Arts & Humanities
Business
Campus & Community
Education
President
Strategic Plan
Health
Science & Tech
Saturday, May 30, 2026
News Releases
Contact
Login
Email
Blackboard
ULink
UofLNews
LOG IN
Welcome! Log into your account
Forgot your password?
Recover your password
UofL News
Arts & Humanities
Arts & Humanities
2026 Grawemeyer Award honorees bring bold ideas to Louisville
Arts & Humanities
The key to perks in the city: Your Cardinal Card
Arts & Humanities
See the future of design: UofL student showcase, supported by Canon
Arts & Humanities
No place like home
Arts & Humanities
UofL helps roll out a new canvas for local art makers…
Business
Business & Economy
UofL’s new high-performance computing system accelerates research with AI
Business & Economy
UofL College of Business launches global supply chain management degree
Business & Economy
UofL breaks ground on $280-million facility for health education and collaboration
Business & Economy
UofL President Gerry Bradley among Louisville’s most influential people
Business & Economy
UofL renovates Texas Roadhouse Student Center in College of Business
Campus & Community
Campus & Community
UofL student team wins intercollegiate pitch competition
Campus & Community
New UofL scholarship funded by The Humana Foundation honors alumna Heidi…
Belonging & Access
UofL’s Douglas Craddock named fellow of the American Council on Education
Campus & Community
UofL’s Get Healthy Now program earns top recognition
Campus & Community
Aaron Calhoun receives UofL Trustees Award
Education
All
President
Strategic Plan
Belonging & Access
UofL’s Douglas Craddock named fellow of the American Council on Education
Business & Economy
UofL College of Business launches global supply chain management degree
Campus & Community
Sen. Tom Cotton visits UofL’s McConnell Center
Business & Economy
UofL breaks ground on $280-million facility for health education and collaboration
Health
Campus & Community
UofL’s Get Healthy Now program earns top recognition
Business & Economy
UofL breaks ground on $280-million facility for health education and collaboration
Health & Wellness
UofL study shows living near trees benefits the immune system
Campus & Community
UofL’s Trager Institute culinary medicine program takes off
Campus & Community
Construction begins for Chestnut Street transformation at UofL Health Sciences Center
Science & Tech
Business & Economy
UofL’s new high-performance computing system accelerates research with AI
Health & Wellness
UofL study shows living near trees benefits the immune system
Campus & Community
Construction begins for Chestnut Street transformation at UofL Health Sciences Center
Science & Tech
UofL scientist helps decode six ape genomes
Science & Tech
Unique statistical approach lends promise to therapies for rare childhood brain…
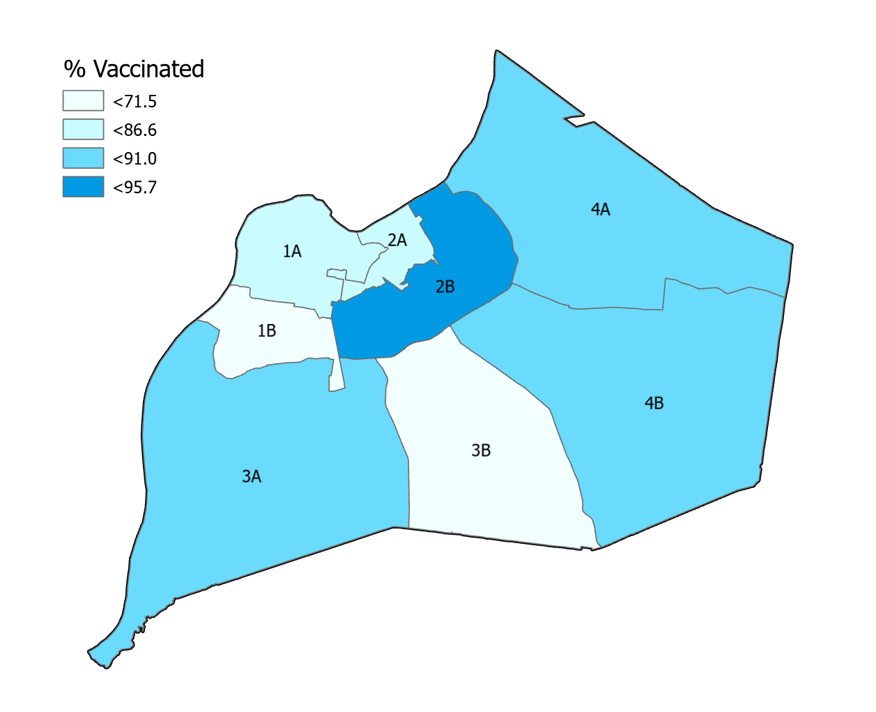
Figure 4 shows the percentage of tested individuals by zone who reported being vaccinated.
Figure 4 shows the percentage of tested individuals by zone who reported being vaccinated.